
To help health and care systems across the region gain a clearer understanding of health inequalities, NHS Midlands asked Arden & GEM to develop a health inequalities dashboard.
Through a process of engaging stakeholders, identifying and evaluating potential indicators, and designing an intuitive format, a new dashboard has been created to support commissioners in identifying priorities and developing interventions to tackle avoidable and unjust inequalities in health experience and outcomes.
Challenge
Health inequalities – the observable difference in health experience and outcomes between groups of people – have been brought into sharp focus by COVID-19.
To gain a clear understanding of health inequalities, health and care systems need to decide what they will measure, how they will measure and where to focus attention. To help achieve this goal, the NHS Midlands region wanted to develop a health inequalities dashboard that would support commissioners in identifying priorities and developing interventions to tackle avoidable and unjust inequalities in health experience and outcomes.
Solution
With experiencing of designing and developing healthcare dashboards for national, regional and local use, Arden & GEM’s Advanced Analytics Unit was selected to engage with stakeholders to agree a set of evidence-based indicators that capture health inequalities in the Midlands region. These indicators were incorporated into the NHS Midlands health inequalities dashboard which went live in July 2021.
The dashboard uses linked datasets and advanced analytical methods to show the presence of health inequalities, their magnitude and trend over time. This intelligence gives commissioners a clearer understanding of health inequalities to identify priorities and develop interventions.
What we did
Our team’s first task was to work with a group of stakeholders, representing regional organisations – including CCGs, Public Health and Trusts – and specific care pathways, such as elderly and mental health, to agree a list of indicators.
Dedicated sessions were facilitated to give the group participants a common grounding in the key concepts, models and terminology surrounding health inequalities. The group was then asked to evaluate and rate potential metrics for inclusion in the dashboard. Over 100 indicators were ranked based on relevance, ability to measure and impactability. This ensured that the final shortlist of 25 indicators were accessible and had a clear health outcome.
The second phase of the project was to translate the agreed indicators into a ‘balanced scorecard’ for systems in the Midlands region. Our data experts sourced, quality assured, linked and constructed datasets into a usable format while our dashboard specialists worked with the inequalities stakeholder group to design a view that was clear and intuitive. This process was made as efficient as possible by using programming language to automate analysis on annual records for 60+ million people.
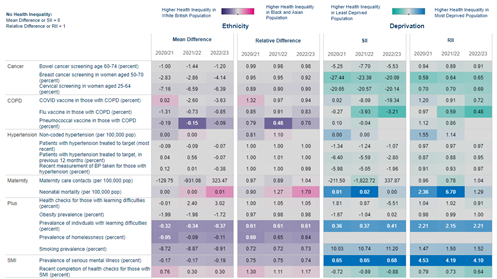
To help users make like for like comparisons between indicators, progression and trends are shown using sparklines, with the use of neutral colours to avoid normative meaning being attached.
Product delivery
The dashboard was launched to users with an accompanying user guide in July 2021. Early findings have demonstrated the potential of the dashboard in identifying inequalities in key priority areas and focusing interventions on tackling these. For example:
Examining the determinants of health
The dashboard has shown that the burden of diabetes is more than twice as prevalent in the Black and Asian population in the Midlands than in the White subgroup.
Identifying regional variation
Our analysis has shown that alcohol-related admissions are approximately seven times higher in the most deprived population in England, but ten times higher in the most deprived areas of the Midlands.
Benefits
- Regional stakeholders have ownership of the health inequality measures used as a result of the extensive engagement process.
- Through using advanced analytical methods, the dashboard shows not only the presence of health inequalities but their magnitude and trend over time.
- The dashboard can be easily and quickly adapted to meet the needs of other regions, or systems, by utilising the existing engagement and analytic frameworks.
- Early findings from the dashboard are already supporting commissioners to set priorities and make funding decisions on initiatives that tackle inequalities.
Find out more about the Advanced Analytics Unit and our health inequalities work here.